
News & Events
Google PageSpeed Insights – Complete SEO Guide
No Comments
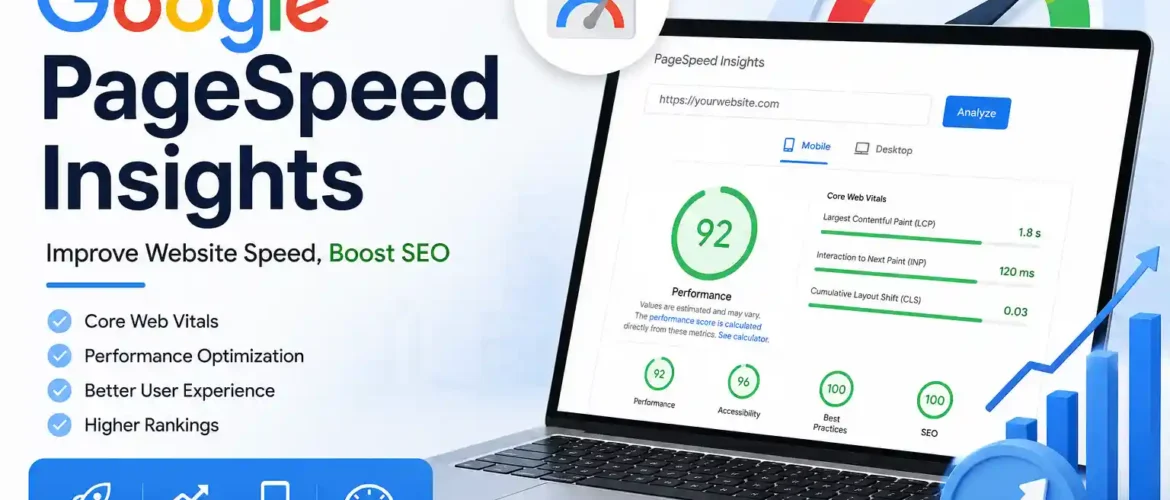
Google PageSpeed Insights (PSI) is a free performance analysis tool developed by Google. It measures how fast a webpage loads on both mobile and desktop, evaluates user experience, and provides recommendations to improve website performance, Core Web Vitals, accessibility, best practices, Agentic Browsing, and technical SEO. PSI combines real-world user data (Chrome UX Report) with Lighthouse lab testing to help developers identify performance bottlenecks.
What is Google PageSpeed Insights?
PageSpeed Insights analyzes a single webpage and provides detailed reports on:
- Website Performance
- Core Web Vitals
- Accessibility
- Best Practices
- SEO
- Performance Opportunities
- Diagnostics
It helps website owners understand why a webpage is slow and how to improve loading speed and user experience.
Why is PageSpeed Important for SEO?
Google considers page experience and Core Web Vitals as ranking signals. While content quality and relevance remain more important, a fast-loading website generally provides a better user experience, which can improve engagement and support SEO performance.
SEO Benefits
- Better User Experience
- Lower Bounce Rate
- Faster Mobile Performance
- Improved Crawl Efficiency
- Higher Conversion Rate
- Better Core Web Vitals
- Improved Google Rankings (when combined with quality content)
How to Use PageSpeed Insights
Step 1
Visit
Step 2
Enter your webpage URL.
Example:
https://kingofseo.inStep 3
Click Analyze
Google tests:
- Mobile
- Desktop
Step 4
Review the report.
Sections Available in the Report
1. Performance Score
Measures loading speed.
| Score | Status |
|---|---|
| 90–100 | Excellent |
| 50–89 | Needs Improvement |
| 0–49 | Poor |
2. Accessibility
Checks whether your website is usable by everyone, including people with disabilities.
Examples:
- Image ALT Text
- Color Contrast
- ARIA Labels
- Keyboard Navigation
3. Best Practices
Checks for:
- HTTPS
- Secure Resources
- JavaScript Errors
- Browser Compatibility
- Safe Coding Practices
4. SEO
Basic technical SEO checks, such as:
- Meta Viewport
- Title Tag
- Meta Description
- Crawlability
- Robots Directives
- Mobile Friendliness
Core Web Vitals
These are Google’s most important user experience metrics.
1. LCP (Largest Contentful Paint)
Measures loading performance.
Good:
Less than 2.5 seconds
Example:
Homepage banner loads in 1.8 seconds.
2. INP (Interaction to Next Paint)
Measures how quickly the page responds to user interactions.
Good:
Less than 200 ms
Example:
User clicks “Buy Now” and the button responds immediately.
3. CLS (Cumulative Layout Shift)
Measures visual stability.
Good:
Less than 0.1
Example:
Buttons and images do not move unexpectedly while the page loads.
Other Performance Metrics
FCP (First Contentful Paint)
Shows when the first visible content appears.
Good:
Less than 1.8 seconds
Speed Index
Measures how quickly visible content appears.
TBT (Total Blocking Time)
Measures how long JavaScript blocks the main thread.
Lower is better.
TTFB (Time to First Byte)
Measures server response time.
Good:
Below 800 ms
Field Data vs Lab Data
Field Data
Collected from real Chrome users over approximately the last 28 days.
Useful for:
- Real user experience
- Core Web Vitals assessment
Lab Data
Collected in a controlled Lighthouse test.
Useful for:
- Debugging
- Testing changes before deployment
Example Report
Website:
https://kingofseo.inResults:
Performance
85
Accessibility
96
Best Practices
100
SEO
100
Core Web Vitals
LCP
2.1s
CLS
0.03
INP
180ms
Overall:
Needs slight performance improvement.
Common Recommendations
Optimize Images
- Convert JPEG → WebP
- Use AVIF
- Compress images
- Lazy Load Images
Reduce JavaScript
- Remove unused JS
- Minify files
- Defer JavaScript
Optimize CSS
- Remove unused CSS
- Minify CSS
- Inline critical CSS
Improve Server Response
- Faster hosting
- Enable caching
- Use a CDN
Enable Compression
- Gzip
- Brotli
Browser Caching
Cache:
- Images
- CSS
- JS
- Fonts
Reduce Redirects
Bad:
A → B → CGood:
A → CImprove Fonts
- Preload fonts
- Use WOFF2
- Reduce font variants
Lazy Loading
Load images only when they become visible on screen.
How PageSpeed Helps SEO
Google recommends using PageSpeed Insights to identify technical issues affecting user experience. While a perfect score is not required for good rankings, improving Core Web Vitals and reducing loading delays can positively impact SEO, especially for mobile users.
Benefits include:
- Better User Experience
- Better Mobile Experience
- Faster Crawling
- Lower Bounce Rate
- Higher Conversion Rate
- Better Engagement
- Improved Core Web Vitals
Best Practices Checklist
- ✅ Use HTTPS
- ✅ Compress Images
- ✅ Convert Images to WebP/AVIF
- ✅ Minify CSS & JavaScript
- ✅ Enable Browser Caching
- ✅ Enable Gzip/Brotli Compression
- ✅ Reduce Server Response Time
- ✅ Lazy Load Images
- ✅ Preload Critical Resources
- ✅ Optimize Fonts
- ✅ Remove Unused Code
- ✅ Use a CDN
- ✅ Fix Layout Shifts
- ✅ Improve Mobile Performance
- ✅ Monitor Core Web Vitals regularly
Frequently Asked Questions (FAQ)
1. Is PageSpeed Insights free?
Yes. Google provides it free of charge.
2. Does PageSpeed affect SEO?
Yes. Page experience and Core Web Vitals are ranking signals, though they are only one part of Google’s ranking systems.
3. What is a good PageSpeed score?
A score between 90 and 100 is considered excellent.
4. Why is the mobile score lower than the desktop score?
Mobile testing simulates slower devices and network conditions, so scores are often lower.
5. Can I get a 100/100 score?
Sometimes, but it is not necessary. Focus on delivering a fast, stable experience for real users.
6. Does PageSpeed test the whole website?
No. It analyzes only the specific URL you enter. Test important pages individually or use Google Search Console for site-wide Core Web Vitals.
7. How often should I test my website?
After major changes and as part of your regular technical SEO audits.
Conclusion
Google PageSpeed Insights is one of the most valuable tools for technical SEO and website optimization. By improving Core Web Vitals, optimizing images and code, reducing server response times, and following the tool’s recommendations, you can build a faster website that offers a better user experience and supports stronger search visibility.